Chart Usage Advice
Posted
#1
(In Topic #1307)
Enthusiast
I hope someone could explain to me what I am doing wrong
I have been using post http://forum.gambas.one/viewtopic.php?p=1193 as a base for what I am trying to do
I am trying to use a Chart to show taking for the 12 months (both sales and Refunds) I have the following code that I have come up with after reading a lot
of posts on here
Code (gambas)
- hChart1.Colors.Values = [Color.green, Color.red]
- DrawingArea1.Refresh
- hChart1.type = ChartType.ColumnsStacked
- hChart1.Legend.Title = "Legend"
- '
- hChart1.headers.values = ["Sales", "Refunds"]
- hChart1.CountDataSets = 12
- hChart1[0].Text = "Month"
- hChart1[0].values = [12, 0]
- hChart1[0].Values = [DataFromDatabase_Sale[1], DataFromDatabase_Sale[2], DataFromDatabase_Sale[3], DataFromDatabase_Sale[4], DataFromDatabase_Sale[5], DataFromDatabase_Sale[6], DataFromDatabase_Sale[7], DataFromDatabase_Sale[8], DataFromDatabase_Sale[9], DataFromDatabase_Sale[10], DataFromDatabase_Sale[11], DataFromDatabase_Sale[12]]
- hChart1[1].Values = [DataFromDatabase_Refund[1], DataFromDatabase_Refund[2], DataFromDatabase_Refund[3], DataFromDatabase_Refund[4], DataFromDatabase_Refund[5], DataFromDatabase_Refund[6], DataFromDatabase_Refund[7], DataFromDatabase_Refund[8], DataFromDatabase_Refund[9], DataFromDatabase_Refund[10], DataFromDatabase_Refund[11], DataFromDatabase_Refund[12]]
But I am not getting anything on the screen.
The DataFromDatabase_Sale[1] - DataFromDatabase_Sale[12] is the sale data loaded from the database
The DataFromDatabase_Refund[1] - DataFromDatabase_Refund[12] is the Refund data loaded from the database
below is a Debug print out of the data from the database
Code
0.00   0.00
0.00   0.00
0.00   0.00
0.00   0.00
5357.61        238.96
7962.02        161.00
11448.19       145.98
1415.19        5.99
0.00   0.00
0.00   0.00
0.00   0.00
0.00   0.00
**Added 05/08/2024**
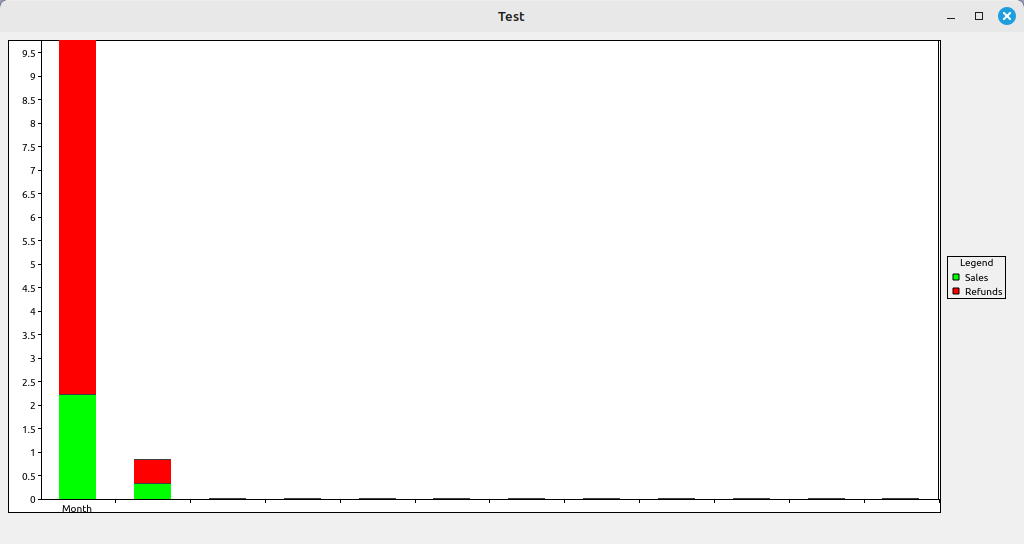
This is the result i am getting on screen
<IMG src="https://support.algpos.co.uk/images_help/blankChart.png">
Could someone show me what I am doing wrong and if possible show me how I can get the months across the bottom I would appreciated that a lot

Posted

Guru
Run the code in a new graphical program.
Code (gambas)
- DrawingArea1 As DrawingArea
- BuildForm
- Chart[0].Values = [DataFromDatabase_Sale[1], DataFromDatabase_Sale[2], DataFromDatabase_Sale[3], DataFromDatabase_Sale[4], DataFromDatabase_Sale[5], DataFromDatabase_Sale[6], DataFromDatabase_Sale[7], DataFromDatabase_Sale[8], DataFromDatabase_Sale[9], DataFromDatabase_Sale[10], DataFromDatabase_Sale[11], DataFromDatabase_Sale[12]]
- Chart[1].Values = [DataFromDatabase_Refund[2], DataFromDatabase_Refund[3], DataFromDatabase_Refund[4], DataFromDatabase_Refund[5], DataFromDatabase_Refund[6], DataFromDatabase_Refund[7], DataFromDatabase_Refund[8], DataFromDatabase_Refund[9], DataFromDatabase_Refund[10], DataFromDatabase_Refund[11], DataFromDatabase_Refund[12]]
- iHeight = DrawingArea1.Height - 20
- iWidth = DrawingArea1.Width - 10
- .H = 512
- .W = 1024
- .Arrangement = Arrange.Vertical
- .Padding = 5
<IMG src="https://www.cogier.com/gambas/ChartEx.png">
 </IMG>
Posted
Enthusiast
cogier
Once I am back at my development computer I shall post the complete code I am using to generate the chart.
In the mean time I shall study what you have written to see where I'm going wrong.
Posted
Enthusiast
cogier said
I have taken as much of your code as I can to get this working. Some of the code has been taken from my ChartExample with is on the Gambas Farm.
Run the code in a new graphical program.
Hi Cogier,
Please see below the code I am using to generate the Chart. I have tired to integrate you code (Even though your code is a lot more cleaner then mine)
but I am still getting a blank chart.
I have a drawingarea1 already placed on the screen where I want the chart to show (this is why It is not declared anywhere)
for some reason when my form loads the drawingarea1_draw is called and if I don't have If Chart.Count > 0 Then then I get a error saying Chart null. (and it would be null as nothing has been loaded into the chart yet lol)
I MAY be recalling the data wrong from the database to start with I am am not sure anymore

Code (gambas)
- ' Gambas class file
- frmSiteFunctionMenu.Close
- frmbackground.Workspace1.Add(frmDashBoard, 0)
- GetChartDAta_1
- Chart[0].Values = [DataFromDatabase_Sale[1], DataFromDatabase_Sale[2], DataFromDatabase_Sale[3], DataFromDatabase_Sale[4], DataFromDatabase_Sale[5], DataFromDatabase_Sale[6], DataFromDatabase_Sale[7], DataFromDatabase_Sale[8], DataFromDatabase_Sale[9], DataFromDatabase_Sale[10], DataFromDatabase_Sale[11], DataFromDatabase_Sale[12]]
- Chart[1].Values = [DataFromDatabase_Refund[2], DataFromDatabase_Refund[3], DataFromDatabase_Refund[4], DataFromDatabase_Refund[5], DataFromDatabase_Refund[6], DataFromDatabase_Refund[7], DataFromDatabase_Refund[8], DataFromDatabase_Refund[9], DataFromDatabase_Refund[10], DataFromDatabase_Refund[11], DataFromDatabase_Refund[12]]
- iHeight = DrawingArea1.Height - 20
- iWidth = DrawingArea1.Width - 10
- DataFromModule = BackOffice_Dashboard_Charts.GetMonthlyTakingsFromDatabase(i)
- DataFromDatabase_Sale[i] = DataToSplit[0]
- DataFromDatabase_Refund[i] = DataToSplit[1]
This is the Function form the BackOffice_Dashboard_Charts.GetMonthlyTakingsFromDatabase()
Code (gambas)
- Global.BackOfficeQuery &= "Select "
- Global.BackOfficeQuery &= "abs(SUM(cashvalue)) as TotalCash, "
- Global.BackOfficeQuery &= "abs(SUM(chequevalue)) as TotalCheque, "
- Global.BackOfficeQuery &= "abs(SUM(cardvalue)) as TotalCard, "
- Global.BackOfficeQuery &= "abs(SUM(couponvalue)) as TotalCoupon, "
- Global.BackOfficeQuery &= "abs(SUM(giftvouchervalue)) as TotalGiftVoucher, "
- Global.BackOfficeQuery &= "abs(SUM(giftcardvalue)) as TotalGiftCard, "
- Global.BackOfficeQuery &= "abs(SUM(accountvalue)) as TotalAccounts, "
- Global.BackOfficeQuery &= "abs(SUM(safedropvalue)) as TotalSafeDrop, "
- Global.BackOfficeQuery &= "abs(SUM(cashvalue_refund)) as TotalCashRefund, "
- Global.BackOfficeQuery &= "abs(SUM(chequevalue_refund)) as TotalChequeRefund, "
- Global.BackOfficeQuery &= "abs(SUM(cardvalue_refund)) as TotalCardRefund, "
- Global.BackOfficeQuery &= "abs(SUM(couponvalue_refund)) as TotalCouponRefund, "
- Global.BackOfficeQuery &= "abs(SUM(giftvouchervalue_refund)) as TotalGiftVoucherRefund, "
- Global.BackOfficeQuery &= "abs(SUM(giftcardvalue_refund)) as TotalGiftCardRefund, "
- Global.BackOfficeQuery &= "abs(SUM(accountvalue_refund)) as TotalAccountsRefund "
- Global.BackOfficeQuery &= "from posfigures "
- Global.BackOfficeQuery &= "where datecol BETWEEN '" & RequestedDate & "' and '"
- Global.BackOfficeQuery &= RequestedEndDate & "';"
- BackofficeDatabase.ConnectToBackOfficeDatabase("Open")
Posted
Guru
I modified the code in your last post as below:-
Code (gambas)
- ' Gambas class file
- 'Chart As New Chart
- 'DataFromDatabase_Sale As New Float[13]
- 'DataFromDatabase_Refund As New Float[13]
- 'If Global.BeepOnKeyPress = "Yes" Then SystemFunctions.PCSpeakerBleep(500)
- 'GetChartDAta_1
- Chart[0].Values = [DataFromDatabase_Sale[1], DataFromDatabase_Sale[2], DataFromDatabase_Sale[3], DataFromDatabase_Sale[4], DataFromDatabase_Sale[5], DataFromDatabase_Sale[6], DataFromDatabase_Sale[7], DataFromDatabase_Sale[8], DataFromDatabase_Sale[9], DataFromDatabase_Sale[10], DataFromDatabase_Sale[11], DataFromDatabase_Sale[12]]
- Chart[1].Values = [DataFromDatabase_Refund[2], DataFromDatabase_Refund[3], DataFromDatabase_Refund[4], DataFromDatabase_Refund[5], DataFromDatabase_Refund[6], DataFromDatabase_Refund[7], DataFromDatabase_Refund[8], DataFromDatabase_Refund[9], DataFromDatabase_Refund[10], DataFromDatabase_Refund[11], DataFromDatabase_Refund[12]]
- DrawingArea1.Refresh ''You seem to need this if the Form is already open
- iHeight = DrawingArea1.Height - 20
- iWidth = DrawingArea1.Width - 10
Posted
Enthusiast
cogier said
I discovered that you need DrawingArea1.Refresh if the Form is already open.
I modified the code in your last post as below:-
Hi Cogier,
I update my code and if I use your example data it works perfectly but If I try to use data from my database I just a blank chart.
below is the updated code that I use to generate the chart
Code (gambas)
- GetChartDAta_1("Sale", 3), GetChartDAta_1("Sale", 4), GetChartDAta_1("Sale", 5),
- GetChartDAta_1("Sale", 6), GetChartDAta_1("Sale", 7), GetChartDAta_1("Sale", 8),
- GetChartDAta_1("Sale", 9), GetChartDAta_1("Sale", 10), GetChartDAta_1("Sale", 11),
- GetChartDAta_1("Sale", 12)]
- GetChartDAta_1("Refund", 3), GetChartDAta_1("Refund", 4), GetChartDAta_1("Refund", 5),
- GetChartDAta_1("Refund", 6), GetChartDAta_1("Refund", 7), GetChartDAta_1("Refund", 8),
- GetChartDAta_1("Refund", 9), GetChartDAta_1("Refund", 10), GetChartDAta_1("Refund", 11),
- GetChartDAta_1("Refund", 12)]
- Chart[0].Values = [DataFromDatabase_Sale[1], DataFromDatabase_Sale[2], DataFromDatabase_Sale[3], DataFromDatabase_Sale[4], DataFromDatabase_Sale[5], DataFromDatabase_Sale[6], DataFromDatabase_Sale[7], DataFromDatabase_Sale[8], DataFromDatabase_Sale[9], DataFromDatabase_Sale[10], DataFromDatabase_Sale[11], DataFromDatabase_Sale[12]]
- Chart[1].Values = [DataFromDatabase_Refund[2], DataFromDatabase_Refund[3], DataFromDatabase_Refund[4], DataFromDatabase_Refund[5], DataFromDatabase_Refund[6], DataFromDatabase_Refund[7], DataFromDatabase_Refund[8], DataFromDatabase_Refund[9], DataFromDatabase_Refund[10], DataFromDatabase_Refund[11], DataFromDatabase_Refund[12]]
- DrawingArea1.Refresh ''You seem to need this if the Form is already open
I have updated the GetChartData_1 and this is below
Code (gambas)
I have also updted the Sub for getting the data from the Database
Code (gambas)
- Global.BackOfficeQuery &= "Select "
- Global.BackOfficeQuery &= "cast(abs(IFNULL(SUM(cashvalue / 100),0)) as DECIMAL(18,2)) as TotalCash, "
- Global.BackOfficeQuery &= "cast(abs(IFNULL(SUM(chequevalue / 100),0)) as DECIMAL(18,2)) as TotalCheque, "
- Global.BackOfficeQuery &= "cast(abs(IFNULL(SUM(cardvalue / 100),0)) as DECIMAL(18,2)) as TotalCard, "
- Global.BackOfficeQuery &= "cast(abs(IFNULL(SUM(couponvalue / 100),0)) as DECIMAL(18,2)) as TotalCoupon, "
- Global.BackOfficeQuery &= "cast(abs(IFNULL(SUM(giftvouchervalue / 100),0)) as DECIMAL(18,2)) as TotalGiftVoucher, "
- Global.BackOfficeQuery &= "cast(abs(IFNULL(SUM(giftcardvalue / 100),0)) as DECIMAL(18,2)) as TotalGiftCard, "
- Global.BackOfficeQuery &= "cast(abs(IFNULL(SUM(accountvalue / 100),0)) as DECIMAL(18,2)) as TotalAccounts, "
- Global.BackOfficeQuery &= "cast(abs(IFNULL(SUM(safedropvalue / 100),0)) as DECIMAL(18,2)) as TotalSafeDrop, "
- Global.BackOfficeQuery &= "cast(abs(IFNULL(SUM(cashvalue_refund / 100),0)) as DECIMAL(18,2)) as TotalCashRefund, "
- Global.BackOfficeQuery &= "cast(abs(IFNULL(SUM(chequevalue_refund / 100),0)) as DECIMAL(18,2)) as TotalChequeRefund, "
- Global.BackOfficeQuery &= "cast(abs(IFNULL(SUM(cardvalue_refund / 100),0)) as DECIMAL(18,2)) as TotalCardRefund, "
- Global.BackOfficeQuery &= "cast(abs(IFNULL(SUM(couponvalue_refund / 100),0)) as DECIMAL(18,2)) as TotalCouponRefund, "
- Global.BackOfficeQuery &= "cast(abs(IFNULL(SUM(giftvouchervalue_refund / 100),0)) as DECIMAL(18,2)) as TotalGiftVoucherRefund, "
- Global.BackOfficeQuery &= "cast(abs(IFNULL(SUM(giftcardvalue_refund / 100),0)) as DECIMAL(18,2)) as TotalGiftCardRefund, "
- Global.BackOfficeQuery &= "cast(abs(IFNULL(SUM(accountvalue_refund / 100),0)) as DECIMAL(18,2)) as TotalAccountsRefund "
- Global.BackOfficeQuery &= "from posfigures "
- Global.BackOfficeQuery &= "where datecol BETWEEN '" & RequestedDate & "' and '"
- Global.BackOfficeQuery &= RequestedEndDate & "';"
- BackofficeDatabase.ConnectToBackOfficeDatabase("Open")
- TotalValuesSales += Global.BODataResult!TotalCash
- TotalValuesSales += Global.BODataResult!TotalCheque
- TotalValuesSales += Global.BODataResult!TotalCard
- TotalValuesSales += Global.BODataResult!TotalCoupon
- TotalValuesSales += Global.BODataResult!TotalGiftVoucher
- TotalValuesSales += Global.BODataResult!TotalGiftCard
- TotalValuesSales += Global.BODataResult!TotalAccounts
- TotalValuesRefund += Global.BODataResult!TotalCashRefund
- TotalValuesRefund += Global.BODataResult!TotalChequeRefund
- TotalValuesRefund += Global.BODataResult!TotalCardRefund
- TotalValuesRefund += Global.BODataResult!TotalCouponRefund
- TotalValuesRefund += Global.BODataResult!TotalGiftVoucherRefund
- TotalValuesRefund += Global.BODataResult!TotalGiftCardRefund
- TotalValuesRefund += Global.BODataResult!TotalAccountsRefund
I can not see where the issue is with the retrieval of the data (the data is store in the database as string but the sql request converts it into float for use on the system)
Posted
Guru
Code (gambas)
- GetChartDAta_1("Sale", 3), GetChartDAta_1("Sale", 4), GetChartDAta_1("Sale", 5),
- GetChartDAta_1("Sale", 6), GetChartDAta_1("Sale", 7), GetChartDAta_1("Sale", 8),
- GetChartDAta_1("Sale", 9), GetChartDAta_1("Sale", 10), GetChartDAta_1("Sale", 11),
- GetChartDAta_1("Sale", 12)]
- GetChartDAta_1("Refund", 3), GetChartDAta_1("Refund", 4), GetChartDAta_1("Refund", 5),
- GetChartDAta_1("Refund", 6), GetChartDAta_1("Refund", 7), GetChartDAta_1("Refund", 8),
- GetChartDAta_1("Refund", 9), GetChartDAta_1("Refund", 10), GetChartDAta_1("Refund", 11),
- GetChartDAta_1("Refund", 12)]
Posted

Administrator
sholzy
Gambas One Site Director
To help make creating posts and using the forum a little easier:
Tutorials - Website and forum and Playground
To report bugs in the Gambas IDE:
Official Gambas Bug Tracker
Gambas One Site Director
To help make creating posts and using the forum a little easier:
Tutorials - Website and forum and Playground
To report bugs in the Gambas IDE:
Official Gambas Bug Tracker
Posted
Enthusiast
Got2BeFree said
Anytime I'm dealing with database issues, I use 'db.Debug = True' to watch any database query.
A couple of updates that I though you all would like to know
Fist off @Gpt2BeFree I did not know that db.debug option that is a much quicker way to view the SQL Commands I am send then saving them to a text file and reading it in latter
I found that I was using Integer in the database recall function so I changed that to float and now as you can see from the image below i have it working using columns
<IMG src="https://support.algpos.co.uk/images_help/Graph1.png">
 </IMG>
but I can not get it to work using lines (unless I am using the wrong option)
<IMG src="https://support.algpos.co.uk/images_help/Graph2.png">
 </IMG>
I would like it to look like this (if this option is in the charts then yay if not then I would have to settle for something close)
<IMG src="https://support.algpos.co.uk/images_help/Graph3.png">
 </IMG>
Also does anyone know how I can get the values along the side to show up? (example my biggest value at the moment is £1447.98 and I would like to show that on the side)
Also another quick question if i Have already displayed a chart on screen how would i display another ones (example I have now a customer count chart but if I have the tender chart and then I click the Customer count chart i get under "chart.CountDataSets = 2"
Type mismatch: wanted number, got object[] instead (frmChartReport:98) (and chart.CountDataSets = 2 is on line 98)
Posted
Administrator
AndyGable said
Got2BeFree said
Anytime I'm dealing with database issues, I use 'db.Debug = True' to watch any database query.
A couple of updates that I though you all would like to know
Fist off @Gpt2BeFree I did not know that db.debug option that is a much quicker way to view the SQL Commands I am send then saving them to a text file and reading it in latter
I found that I was using Integer in the database recall function so I changed that to float and now as you can see from the image below i have it working using columns
…
[snipped]
…
Also does anyone know how I can get the values along the side to show up? (example my biggest value at the moment is £1447.98 and I would like to show that on the side)
Glad that was of some help. I usually have 'db.Debug = True' at the beginning of a block I need to watch and 'db.Debug = False' at the end and I'll usually just comment 'db.Debug = True' out when not needed. Most of my projects have it buried somewhere in at least a few different places.
Can't help out on the chart problem since I've never had an occasion to use it.
sholzy
Gambas One Site Director
To help make creating posts and using the forum a little easier:
Tutorials - Website and forum and Playground
To report bugs in the Gambas IDE:
Official Gambas Bug Tracker
Gambas One Site Director
To help make creating posts and using the forum a little easier:
Tutorials - Website and forum and Playground
To report bugs in the Gambas IDE:
Official Gambas Bug Tracker
Posted
Enthusiast
Got2BeFree said
AndyGable said
Got2BeFree said
Anytime I'm dealing with database issues, I use 'db.Debug = True' to watch any database query.
A couple of updates that I though you all would like to know
Fist off @Gpt2BeFree I did not know that db.debug option that is a much quicker way to view the SQL Commands I am send then saving them to a text file and reading it in latter
I found that I was using Integer in the database recall function so I changed that to float and now as you can see from the image below i have it working using columns
…
[snipped]
…
Also does anyone know how I can get the values along the side to show up? (example my biggest value at the moment is £1447.98 and I would like to show that on the side)
Glad that was of some help. I usually have 'db.Debug = True' at the beginning of a block I need to watch and 'db.Debug = False' at the end and I'll usually just comment 'db.Debug = True' out when not needed. Most of my projects have it buried somewhere in at least a few different places.
Can't help out on the chart problem since I've never had an occasion to use it.
You can be sure I will be using that more often now so I can make sure my SQL Commands are correct

1 guest and 0 members have just viewed this.