[solved] gb.chart
Posted
#1
(In Topic #118)

Administrator
sholzy
Gambas One Site Director
To help make creating posts and using the forum a little easier:
Tutorials - Website and forum and Playground
To report bugs in the Gambas IDE:
Official Gambas Bug Tracker
Gambas One Site Director
To help make creating posts and using the forum a little easier:
Tutorials - Website and forum and Playground
To report bugs in the Gambas IDE:
Official Gambas Bug Tracker

Posted

Guru
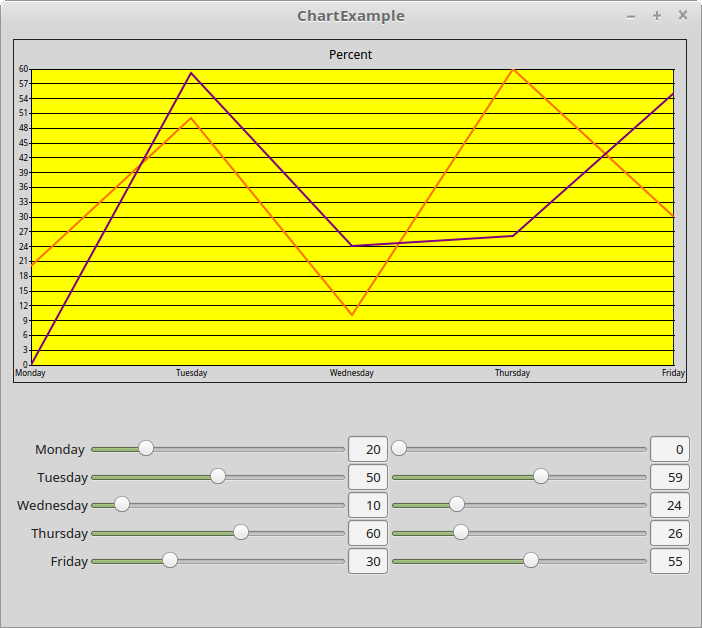
 So I had another look and found 'Chart.CountDataSets' which seems to be what you are looking for. I started with some code from here https://novatocodegamb…nte-gbchart-graficas.html and came up with the attached program.
I hope it helps.
<IMG src="http://www.cogier.com/gambas/ChartExample.png">
 </IMG>
EDIT: - I have put this program on the Gambas Farm as an example.
Posted
Administrator
sholzy
Gambas One Site Director
To help make creating posts and using the forum a little easier:
Tutorials - Website and forum and Playground
To report bugs in the Gambas IDE:
Official Gambas Bug Tracker
Gambas One Site Director
To help make creating posts and using the forum a little easier:
Tutorials - Website and forum and Playground
To report bugs in the Gambas IDE:
Official Gambas Bug Tracker
1 guest and 0 members have just viewed this.